Burnaby Demographics 2025: Population Growth, Diversity, Income & Housing Affordability

So you're trying to figure out Burnaby's demographic landscape in 2025?
Maybe you're house hunting. Maybe you're launching a business. Or maybe you're just trying to understand why your favourite dim sum spot now has a 45-minute wait on Tuesday afternoons.
Whatever brought you here, you need real data about who lives in Burnaby, what they earn, and whether anyone can actually afford to live here anymore.
Let's dig into the numbers that matter.
Burnaby Population Overview 2025
Current Population Statistics
Burnaby isn't just growing—it's exploding.
We're talking about British Columbia's third-largest city, packed with over a quarter-million residents into just 90.57 square kilometres. That's like cramming the entire population of Saskatoon into a space smaller than Disney World.
The latest estimates put Burnaby at 263,046 residents as of 2025, up from 249,125 in the 2021 census.
Key Takeaway: Burnaby's population density is 52,359% higher than the BC average. Yes, you read that right. Not a typo.
Here's what that growth looks like:
|
Year |
Population |
Growth Rate |
|
2016 |
232,755 |
— |
|
2021 |
249,125 |
7.0% |
|
2025 |
263,046 |
5.6% |
Population Growth Projections
Hold onto your toques, because the growth isn't slowing down.
The City of Burnaby projects we'll hit:
- 314,000 by 2031 (1.6% annual growth)
- 345,000 by 2041 (1% annual growth)
That's 120,000+ new neighbours over the next 25 years.
Fun Fact: If Burnaby were a startup, venture capitalists would be throwing money at this growth rate.
Ethnic and Cultural Diversity in Burnaby
Ethnic Composition Breakdown
Here's something you won't find in many Canadian cities: Burnaby has no ethnic majority.
That's right. We're one of the few places in Canada where diversity isn't just a buzzword—it's literally our demographic reality.
The breakdown looks like this:
- Chinese: 33.3% (largest group)
- European: 30.5% (close second)
- South Asian: Rapidly growing
- Filipino: Significant community
- Korean: Established presence
Immigration Statistics
Burnaby is an immigration powerhouse.
Consider this: 57.2% of Burnaby's population consists of immigrants and non-permanent residents. That's up from 55.6% in 2016.
Where are people coming from? The patterns are shifting:
Traditional Sources (still strong):
- China: 31,000 immigrants
- Philippines: 11,000+ immigrants
- Hong Kong: 11,000+ immigrants
New Wave (2016-2021):
- India: Now 18.2% of new arrivals (up from 8%)
- China: Still 25% of new arrivals
Reality Check: Immigrants and non-permanent residents account for four-fifths of Burnaby's population growth since 2016.
Language Demographics
Forget French immersion. In Burnaby, you're more likely to hear Mandarin at the grocery store.
Mother tongues in Burnaby:
- English only: 41.33%
- Mandarin: 14.53%
- Cantonese: 12.32%
- Tagalog: 3.35%
But here's the kicker: Over 120 languages are spoken in Burnaby homes.
Age Demographics and Distribution
Age Group Breakdown
Burnaby's age profile tells a story of transition.
The median age sits at 40.3 years—younger than BC's 43.0-year median. But don't let that fool you into thinking Burnaby's all millennials and avocado toast.
The reality:
- Seniors (65+) are the largest and fastest-growing segment
- Working-age adults (25-64) drive the economy
- Young adults (18-24) cluster around SFU and BCIT
Household Composition
The "traditional" nuclear family? It's becoming less traditional in Burnaby.
Who's living together:
- Singles living alone: 29% (largest group)
- Couples with children: 24%
- Couples without children: 22%
- Multi-generational families: 16% (and growing fast)
Trend Alert: Multi-generational living jumped from 10% to 16% between 2016 and 2021. That's not just culture—that's economics.
Income Levels by Neighbourhood
Median Household Income Analysis
Let's talk money. Because in Burnaby, where you live says a lot about what you earn.
The citywide median household income hit $83,000 in 2021 (before taxes). After taxes? $73,500.
But those are just averages. The real story is in the neighbourhoods.
Highest and Lowest Income Areas
The wealth map of Burnaby:
Highest earners:
- Central Burnaby (near Government Road): $130,000 median
- Morley-Buckingham area
- Douglas-Gilpin vicinity
Lowest earners:
- Edmonds Town Centre
- Parts of South Burnaby
- Select areas in East Burnaby
The gap? It's not subtle. We're talking about a $70,000+ difference in median household income between neighbourhoods just 10 minutes apart.
Housing Affordability Crisis
Current Housing Market Reality
Buckle up. This is where things get painful.
The hard numbers:
- Median home value: $980,000
- Average home price: $1,175,000
- Rental vacancy rate: 1.5% (healthy is 3-5%)
Stark Reality: In 2020, almost 11,700 Burnaby households earned less than $25,000. The median home price is 39 times that.
Income vs. Housing Costs
Let's do the math nobody wants to do.
With a median household income of $83,000:
- Maximum "affordable" home price (3x income): $249,000
- Actual median home price: $980,000
- Affordability gap: $731,000
For renters? The CMHC reports Burnaby's vacancy rate at 1.5%. Translation: Good luck finding anything.
Affordable Housing Initiatives
There's hope on the horizon. Sort of.
What's being built:
- 1,500 new affordable units in development
- Burnaby Housing Authority launching with $100 million funding
- 16 City-owned sites designated for non-market housing
Recent wins:
- 203 units opened at 7392 16th Avenue
- 155 affordable seniors' units at Dania Gardens
- 390 units under construction
But here's the thing: Burnaby needs 74,051 new dwelling units over 20 years. Do the math on 1,500 affordable units.
Neighbourhood Demographic Profiles
Metrotown
The downtown that never sleeps:
- Highest population density in Burnaby
- 67.8% visible minorities
- Mix of luxury condos and older apartments
- Home to BC's largest mall
Brentwood
The transformation zone:
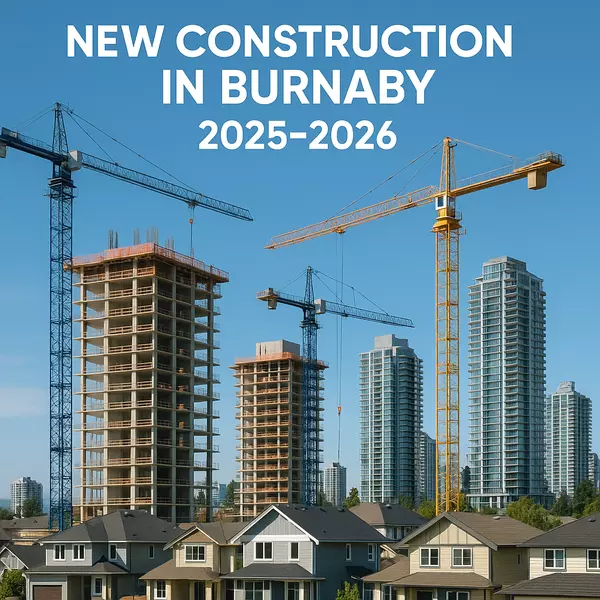
- Rapid high-rise development
- Growing young professional population
- Better income levels than city average
- Transit-oriented community
Lougheed
The next frontier:
- Major development plans underway
- Currently more affordable than Metrotown
- Diverse immigrant communities
- SkyTrain accessibility
Edmonds
The affordability challenge:
- Lowest median incomes in Burnaby
- High proportion of renters
- Diverse, working-class neighbourhood
- Exempt from some affordable housing requirements due to economics
Economic and Employment Demographics
Workforce Statistics
Burnaby's job market is... complicated.
The employment picture:
- Unemployment rate: 9.6%
- Top sectors: Sales/service (34,510 workers)
- Business/finance/admin (27,230 workers)
- Trades/transport (18,640 workers)
Commute reality:
- Average commute: 28 minutes
- Most common: 15-29 minutes (30,030 people)
- Primary mode: Car (despite excellent transit)
Education Levels
Burnaby is seriously educated.
The credentials:
- University degree: 38.2% (81,580 people)
- College diploma: 15.3% (32,740 people)
- High school: 25.9% (55,365 people)
Business Insight: With SFU and BCIT in city limits, Burnaby has become a talent pipeline for tech companies. No wonder EA, D-Wave, and Ballard Power set up shop here.
Future Demographic Trends and Implications
Provincial Housing Legislation Impact
The provincial government dropped a bomb on Burnaby's housing plans in 2024.
What's changing:
- Up to 6 units allowed on single-family lots
- 8-20 storey buildings required near SkyTrain stations
- Zero parking minimums within 400m of frequent transit
- Community amenity contributions? Gone.
Projected Changes 2025-2030
What to expect:
- Continued immigration surge (especially from India)
- More multi-generational housing
- Neighbourhood character shifts
- Infrastructure strain
- Political tensions over development
Crystal Ball: The next 5 years will fundamentally reshape Burnaby's neighbourhoods. The single-family home era? It's officially over.
Practical Resources and Tools
Data Sources and Downloads
Get the data yourself:
- Statistics Canada Census Profiles
- City of Burnaby Open Data
- BC Housing Data
- CMHC Housing Market Information
Neighbourhood Selection Guide
Choosing where to live? Consider:
✅ For families:
- School catchments (check Fraser Institute rankings)
- Parks and recreation centres
- Community centres with programs
✅ For affordability seekers:
- Edmonds (but changing fast)
- Parts of East Burnaby
- Older rental buildings
✅ For investors:
- Transit-oriented areas
- Upcoming development zones
- Areas with older housing stock
FAQs
How does Burnaby's cost of living compare to other Metro Vancouver cities?
Burnaby sits in the middle—pricier than Surrey ($77,494 median income) but cheaper than North Vancouver ($103,981). Your dollar goes further here than in Vancouver proper, but not by much. Factor in better transit access and you might actually save on transportation.
Which Burnaby neighbourhoods are best for young families with children?
South Slope and Burnaby Heights offer the best combo of decent schools, parks, and (relatively) affordable housing. Bonus: both have that neighbourhood feel where kids can actually play street hockey.
What languages should businesses consider for customer service in Burnaby?
Beyond English: Mandarin (14.53%), Cantonese (12.32%), and Tagalog (3.35%) cover your biggest segments. But with Indian immigration surging, add Hindi and Punjabi to your radar.
How is the new provincial housing legislation affecting Burnaby's neighbourhood character?
It's a complete overhaul. Expect your quiet cul-de-sac to sprout multiplexes. Old-timers are furious, newcomers are hopeful, and city planners are scrambling to manage infrastructure for 4x the density.
What demographic factors are driving Burnaby's tech sector growth?
Three things: 38.2% have university degrees, two major post-secondary institutions pump out talent, and 57%+ immigrant population brings global connections. Add competitive commercial lease rates compared to downtown Vancouver, and you've got a tech hub.
The Bottom Line: Burnaby in 2025 is a city in transition. It's diverse, educated, and growing fast. It's also expensive, changing rapidly, and facing serious affordability challenges. Whether that's exciting or terrifying depends entirely on your perspective—and your income bracket.
Categories
Recent Posts





"My job is to find and attract mastery-based agents to the office, protect the culture, and make sure everyone is happy! "